Using the Source Debugger
The Source Debugger is a real-time tool that helps you confirm that API calls made from your website, mobile app, or servers arrive to your Segment Source, so you can troubleshoot your Segment set up even quicker. With the Debugger, you can check that calls are sent in the expected format without having to wait for any data processing.
The Source Debugger’s event order may not reflect how events send downstream or are received by connected destinations. The Debugger primarily confirms incoming data and provides a basic view of its structure. For a reliable record of the data you send to Segment, Segment advises you to attach a raw storage destination to your sources.

The Debugger is separate from your workspace’s data pipeline and is not an exhaustive view of all the events ever sent to your Segment workspace. The Debugger only shows a sample of the events that the Source receives in real time, with a cap of 500 events. The Debugger is a great way to test specific parts of your implementation to validate that events are being fired successfully and arriving to your Source.
To see a more complete view of all your events, Segment recommends that you set up a warehouse or an S3 destination.
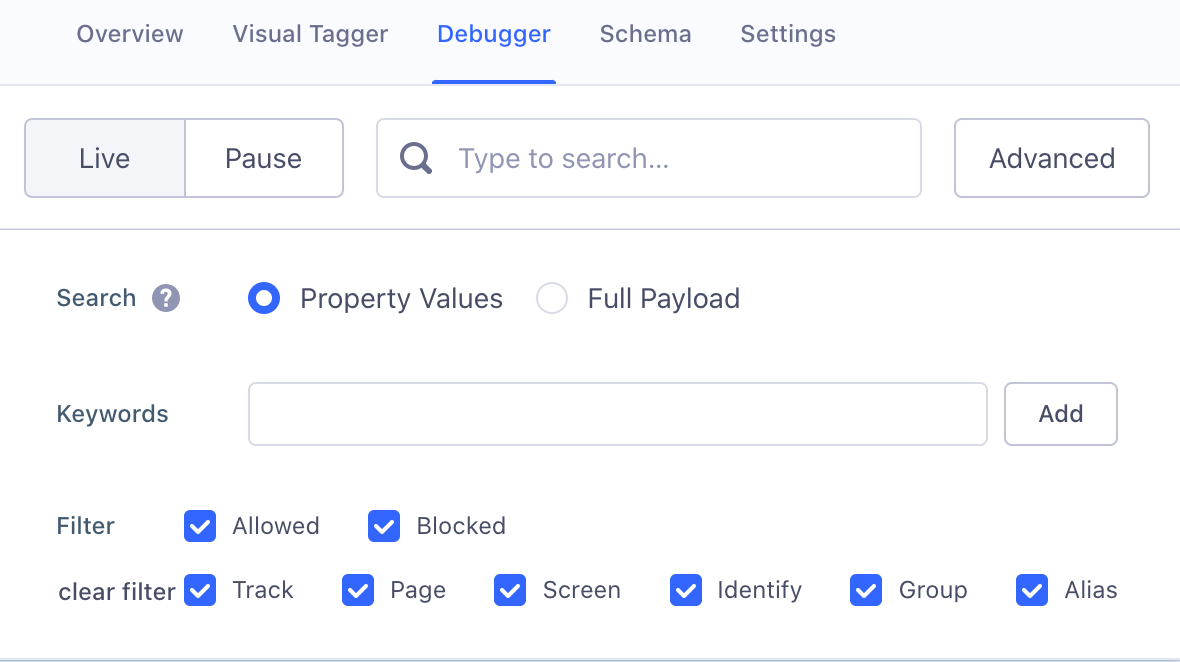
The Debugger shows a live stream of sampled events arriving into the Source, but you can also pause the stream from displaying new events by toggling “Live” to “Pause”. Events continue to arrive to your Source while you Pause the stream.
You can search in the Debugger to find a specific payload using any information you know is available in the event’s raw payload. You can also use advanced search options to limit the results to a specific event.

Two views are available when viewing a payload:
- The Pretty view is an approximate recreation of the API call you made that was sent to Segment. The format shown depends on the library used at the source, and the data displayed may not account for a particular workspace’s unique configuration settings (for example, the region in the API request).
- The Raw view is the complete JSON object Segment received from the calls you sent. These calls include all the details about what is being tracked: timestamps, properties, traits, ids, and contextual information Segment automatically collects the moment the data is sent.
This page was last modified: 11 Apr 2024
Need support?
Questions? Problems? Need more info? Contact Segment Support for assistance!