Warehouse Health Dashboard
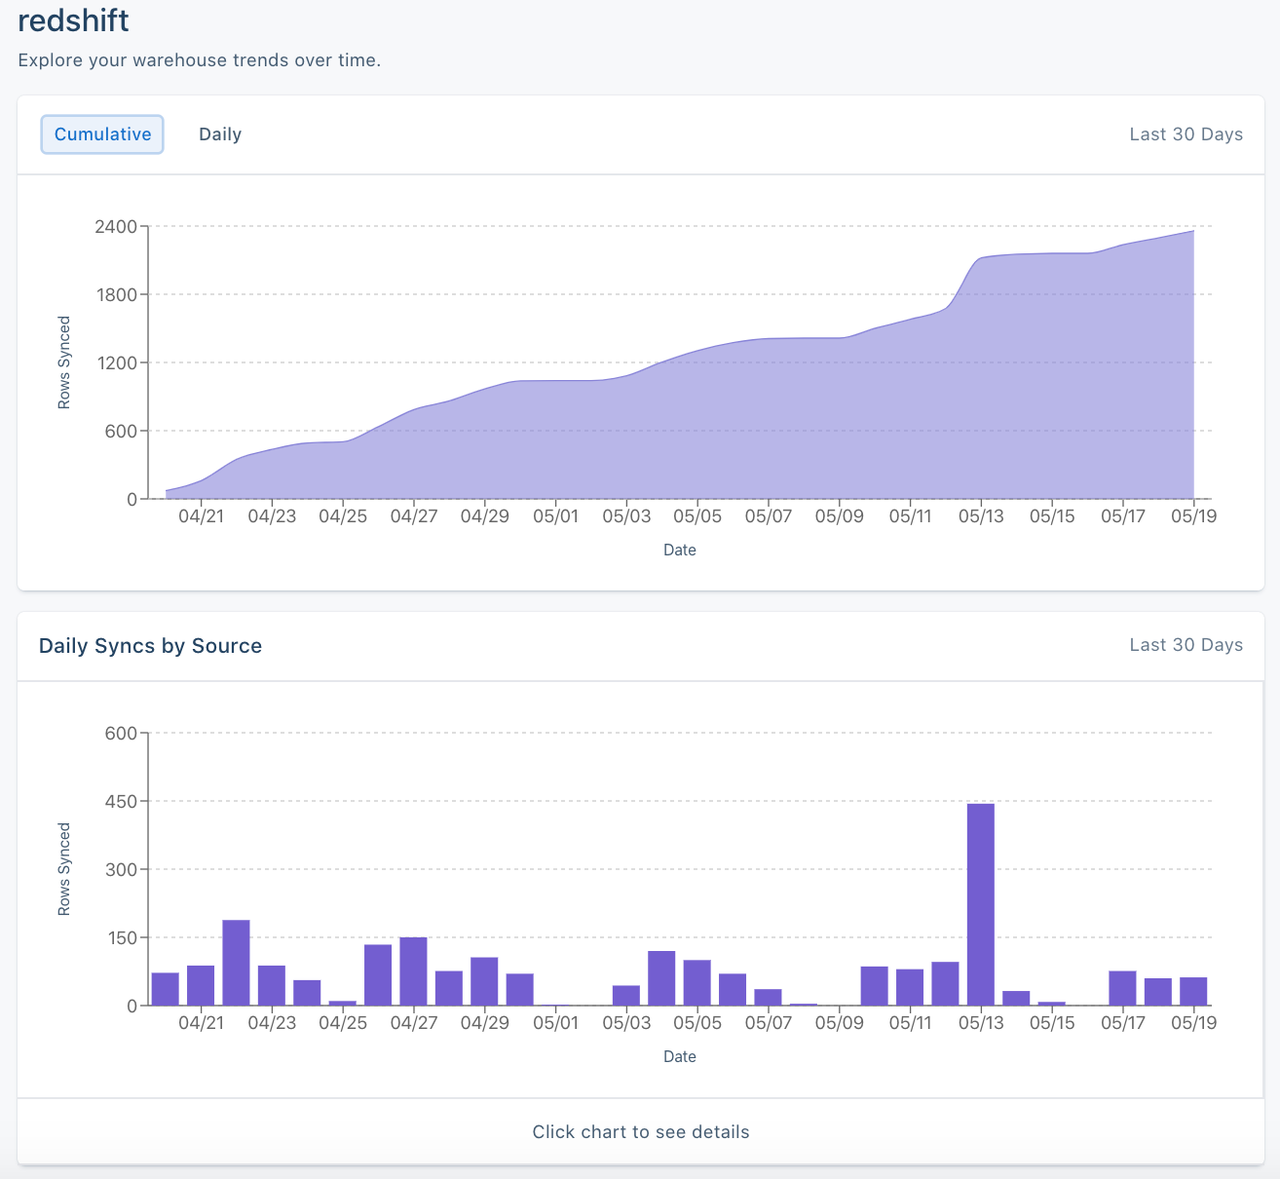
The Warehouse Health dashboard helps you understand trends in data volume (specifically, rows) synced to your data warehouse over time.
You can use this feature to answer questions such as:
- Growth patterns - How has the volume of data synced to the warehouse grown over time? How does this growth align to the storage capacity available in my warehouse?
- Anomaly detection - How much data is being synced on a daily basis? Have there been anomalous spikes or dips that may indicate sudden changes in event volume, sync failures, or something else?
- Data composition - Which sources are contributing the most (or least) amount of data in my warehouse? Which collections make up the majority of data within a source?
Note: Warehouse Health is available for all Warehouse customers.
The Warehouse Health dashboards are available at both the warehouse level, and at the warehouse-source connection level, explained below.
Data in the dashboards updates in real-time, and covers the previous 30 days. The timezones displayed in the dashboards are converted to the viewer’s local time.
Warehouse dashboards
Go to the Segment App, to the Destinations list, and select the warehouse. On the warehouse’s information page, click the Health tab.
This dashboard displays aggregate trends from all sources that sync to the specific warehouse.
 A warehouse level dashboard
Warehouse-Source dashboards
Go to the Segment App, to the Destinations list, and select the warehouse. On the warehouse’s Overview page, select the Source (schema) you want to see data for, then click the Health tab.
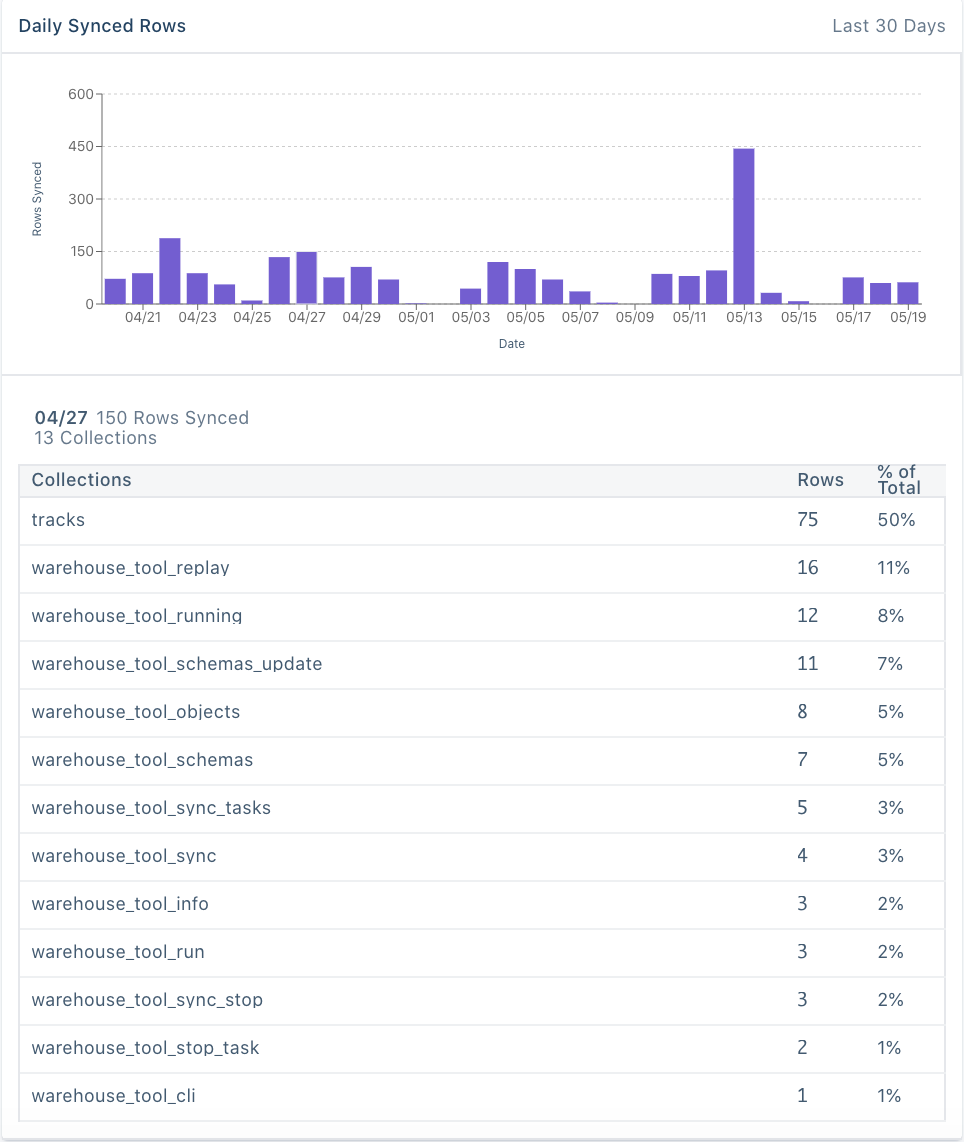
This dashboard displays trends for each separate source that syncs to a specific warehouse. It also displays aggregations of the collections within that source.
 A warehouse-source level dashboard
Warehouse Health Dashboard FAQs
Can I use the Health Dashboard data for QA and validation?
No. These dashboards exist to help you understand high-level trends, but not to provide exact numbers about the data synced to the warehouse. The numbers provided in these dashboards are rounded, and are not exact.
These dashboards will help you understand trends in the data, and use signals to do deeper investigation and QA, as needed.
How is this similar (or different) than the information available in the Sync History and Overview tabs?
The Warehouse Overview, Sync History and Health tabs provide different levels of granularity into warehouse syncs.
- Overview - Shows which sources (also referred to as schemas) are connected to a warehouse, and information about the most recent sync and upcoming sync for each source. This information includes when the last sync happened, what the status of that sync is, how many events were synced, and when the next sync is scheduled.
- Sync History - Shows detailed information about most recent syncs for a specific source connected to a warehouse (warehouse-source level). In this tab you can find information for each sync including sync status, start time, duration, synced rows, and notices about errors and/or warnings.
- Health - The Health tab provides an aggregate view of syncs to a warehouse over time. You can either look at this at a warehouse level, or warehouse-source level. This shows information about the volume of rows synced over the last 30 days.
How often is the data refreshed?
Data is refreshed on a real time basis.
What timeframe is the data available for?
The data available shows the last 30 days.
What timezone are the dates in?
All dates and times found within Warehouse Health, Sync History and Warehouse overview pages are in the user’s local time.
This page was last modified: 21 Apr 2023
Need support?
Questions? Problems? Need more info? Contact Segment Support for assistance!